Planes, Trains and Automobiles
In this lesson, children will graph the different vehicles that they scoop out of a bucket and then analyze their collected data.
Lesson for:
Toddlers/Preschoolers
(See Step 5: Adapt lesson for toddlers or preschoolers.)
Content Area:
Algebra
Data Analysis and Probability
Learning Goals:
This lesson will help toddlers and preschoolers meet the following educational standards:
- Understand patterns, relations and functions
- Formulate questions that can be addressed with data and collect, organize and display relevant data to answer these questions
- Select and use appropriate statistical methods to analyze data
Learning Targets:
After this lesson, toddlers and preschoolers should be more proficient at:
- Sorting, classifying and ordering objects by size, number and other properties
- Sorting and classifying objects according to their attributes and organizing data about the objects
- Representing data using concrete objects, pictures and graphs
- Describing parts of the data and the set of data as a whole to determine what the data show

Planes, Trains and Automobiles
Lesson plan for toddlers/preschoolers
Step 1: Gather materials.
- A bucket of vehicle counters (Learning Resources Mini Motors Counters are available at Staples.com and Amazon.com.)
- A shovel or scoop that fits into the bucket of vehicles
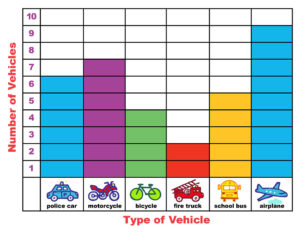
- Large, 1″x1″ graph paper, already labeled, for a bar graph. The various types of vehicles (car, school bus, boat, train, fire truck and plane) should be spaced out along the X-axis (the line on the graph that runs horizontally from left to right). The number of vehicles of each type should be written along the Y-axis (the line on the graph that runs vertically). Do not go higher than 10 at the beginning. Instead of just using the word for each of the vehicles, have a picture of the vehicle accompanying the word. Prepare the bar graph ahead of time so that all that the children need to do is collect and analyze their data.
Note: Small parts pose a choking hazard and are not appropriate for children age five or under. Be sure to choose lesson materials that meet safety requirements.
Step 2: Introduce activity.
- Introduce the concept of a bar graph. Explain that a bar graph is a way in which mathematicians collect information and then study and compare that information.
- Explain that the children are going to use bar graphs to record how many vehicles they scoop out of the bucket. Say: “We want to see what vehicles we collect when we use the scoop to collect vehicles from the bucket. We want to see how many of each vehicle we collect and who scoops the most of one particular vehicle and who collects the least of one particular vehicle. We will be able to determine this is by recording our collections on our bar graphs and then comparing our bar graphs with our friends’ bar graphs.”
Step 3: Engage children in lesson activities.
- Using a bar graph, model the collecting and recording of the vehicles. Scoop a quantity of vehicles out of the bucket and place them in a working space next to your bar graph. Start by sorting all of the like vehicles into groups. Say: “I think that I will make this a little easier by first sorting all of the same vehicles into piles. That way, it will be easier for me to count each group and then record how many are in each group.”
- Invite the children to make statements about what they see. Ask: “How many trains do I have in my pile?” (4) “That’s right. In order to record the four trains on my graph, I must first find the train on my graph and then count up four boxes about the train to symbolize that I have four trains.” Place Xs in each of the boxes. “I have marked off four boxes that represent four trains. Over on this side of the graph, there is the number 4 to help me.”
- Continue graphing the remainder of your vehicles. When you are done, ask the children what they notice. Ask: “What vehicle do I have the most of? What vehicle do I have the least amount of? Do I have the same amount of any vehicles?”
- Give the children their own bar graphs and scoop of vehicles and have them begin graphing their findings. When they are all done, you might want to give them a separate sheet with the following statements:
- I had the most amount of ___________________________.
- I had the least amount of ___________________________.
- I had the same amount of ___________________________.
- Once they are done analyzing their own data, gather the children together to analyze their findings as a group. Ask: “What were the similarities in the data collected? Any differences?”
Additional Extensions
- Have the children create and label their own bar graphs. Give them the graph paper and pose the question: “Using the squares on this paper, how are you going to record the number of each of the vehicles that you scoop out of the bucket?”
- Have the children work in pairs and create a double bar graph. Create the same bar graph, but allow enough space on the X-axis to allow for the findings of both children. Have one child record his/her findings in blue and the other child record his/her findings in a different color. Once they are done recording their data, allow them to compare their findings. Ask: “Who had the most of a vehicle? Who had the least?” Introduce the idea of a key to the children and have them label which color represents which child at the bottom of the graph.
Step 4: Vocabulary.
- Bar Graph: Uses bars to show quantities or numbers so that they can be easily compared (e.g.,”Today we are all going to use bar graphs to record how many vehicles we scoop out of the bucket.”)
- Most: Having the greatest quantity or number (e.g.,”What vehicle do I have the most of?”)
- Least: “Having the smallest quantity or number (e.g.,”What vehicle do you have the least of?”)
- Same: “Identical in kind or quantity (e.g., “Did I have the same amount of any vehicles?”)
Step 5: Adapt lesson for toddlers or preschoolers.
Adapt Lesson for Toddlers
Toddlers may:
- Sort but have trouble with one-to-one correspondence
- Have difficulty lining up the number of a sorted group on the provided bar graph
Child care providers may:
- Help the child count each of the piles of vehicles once they are sorted
- Simplify the bar graph by eliminating the graph paper and using plain paper with pictures of each of the six vehicles on the bottom of the page
Adapt Lesson for Preschoolers
Preschoolers may:
- Be beginning to understand how to read and interpret a simple bar graph
Child care providers may:
- Have the children create and label their own bar graphs. Give them the graph paper and pose the question: “Using the squares on this paper, how are you going to record the number of each vehicle that you scoop out of the bucket?”
- Have the children work in pairs and create a double bar graph. Create the same bar graph, but allow enough space on the X-axis to allow for the findings of each of the children. Have one child record his/her findings in blue and the other child record his/her findings in a different color. Once they’re done recording their data, allow them to compare their findings. “Who had the most of a vehicle? Who had the least?” Introduce the idea of a key to them and have them label which color represents which child at the bottom of the graph.
Suggested Books
- The Greatest Graph Contest by Loreen Leedy (New York: Holiday House, 2006)
- Tiger Math: Learning to Graph from a Baby Tiger by Ann Whitehead Nagda (New York: Square Fish, 2002)
- Lemonade for Sale (MathStart 3) by Stuart J. Murphy (New York: HarperCollins, 1997)
Comment on this lesson